surfit
gridding and contouring software
|
|
Introductionsurfit is a computer program which enables to calculate regular grid from various data (scattered points, 2D and 3D contours, surfaces, etc) in different ways (interpolation, approximation, inequalities, etc). surfit implements the original gridding method. Look at the picture: here is the simplest gridding task, solved by surfit.
The program has the following basic features:
The screenshots and examples describe surfit features in detail, but don't hurry, look at the pictures below, they will give you idea of that surfit can do (some images were made in Surfer 11): Simple scattered points interpolation/approximation.surfit allows you to easy choose between interpolation or approximation of data points. The strength of approximation is a changable parameter: 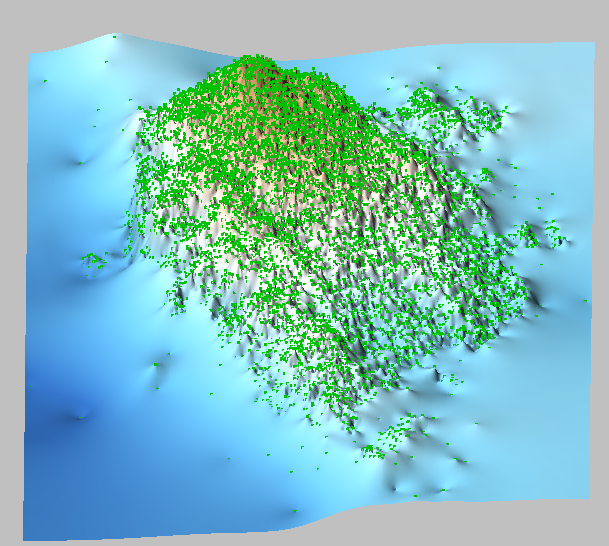
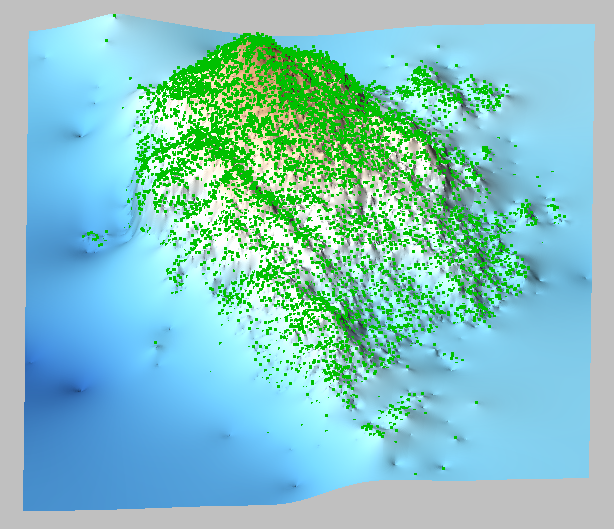
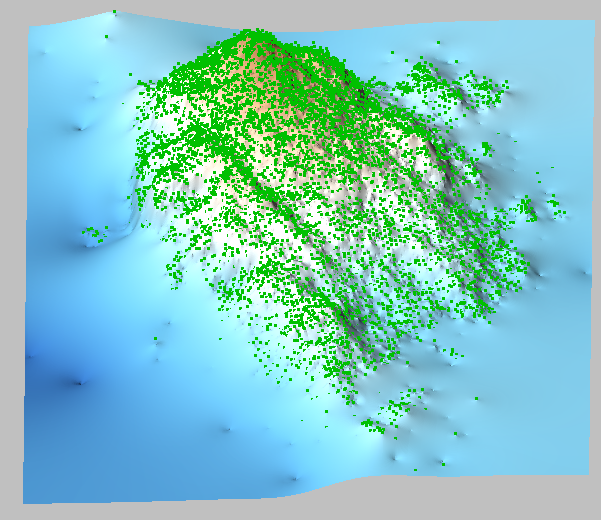
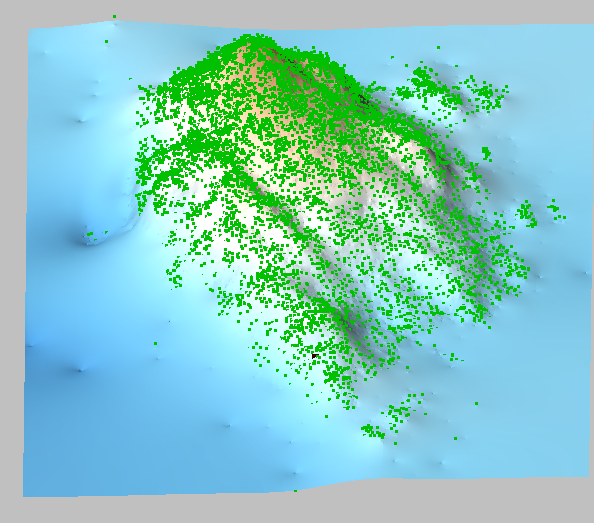
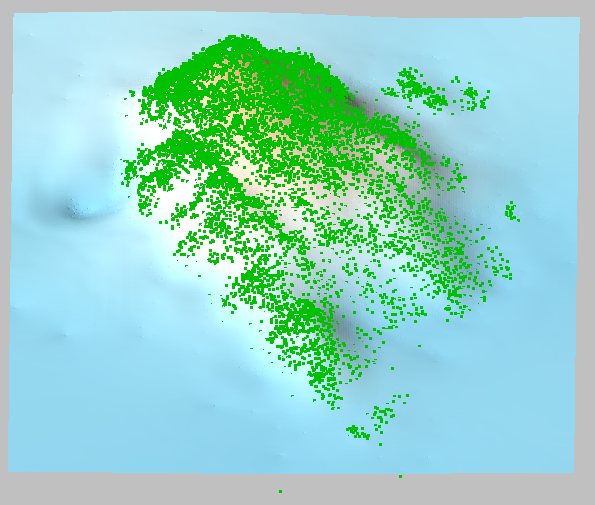
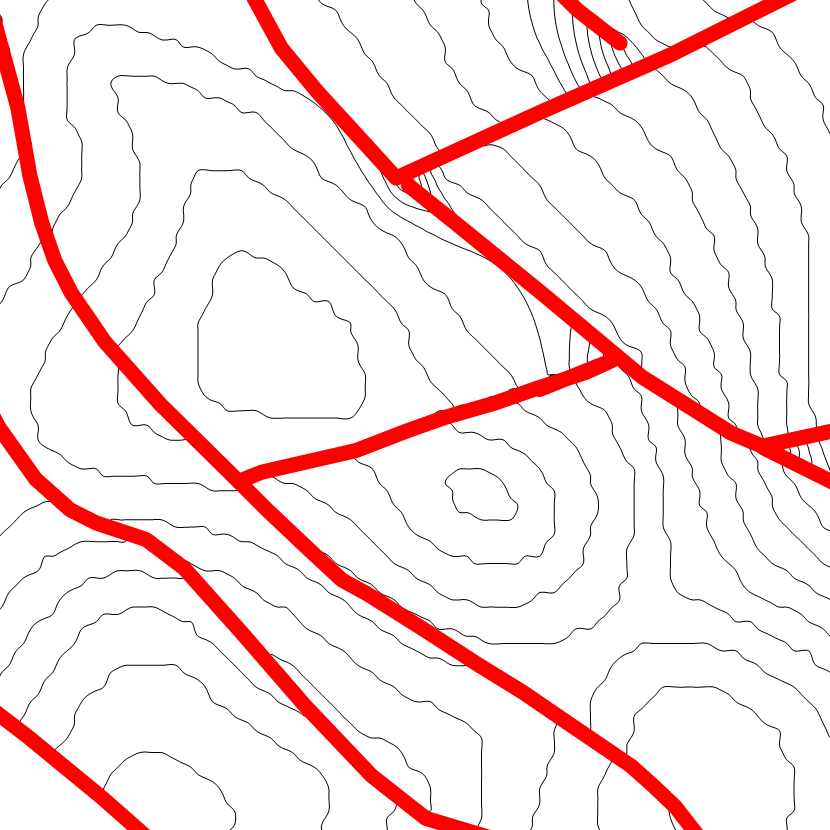
Porosity field estimation with average porosity value condition.Look at the images below - there are results of porosity field reconstruction. The first surface was built from porosity measurments, given in scattered data points (black dots). The second surface was built from the same data plus new condition was added: average porosity value inside data points convex hull (purple line on images) should be equal to 25%. This value is litte lower than average porosity calculated from data points (25.7%). Adding average value condition is one of surfit features. Using it you can add additional information about estimating field. Also you can set "weighted average value" condition. Building of oil reservoir top surface from digitized isolines and faults.Consider usual task - we need to reconstruct reservoir top surface from the set of digitized isolines (level curves). Common way to solve this task is to convert isolines into scattered data points and then build the grid using some gridding algorithm. On the first picture below you can see these scateered data points and fault lines. Result of gridding with surfit is on the second picture. The third picture - result of gridding by Surfer 11 (MINC algorithm). As you can see level curves aren't smooth as we want:
Now we will try to solve this problem in other way. We will not convert isolines into scattered data points - we will use isolines as isolines in gridding method, i.e. we add condition that isolines, traced from the resulting grid should be equal to given isolines:
On the first picture sorce isolines are blue, fault lines are red. On the second picture is the result of gridding with surfit. So, as you can see resulting grid isolines are smooth. And I want to notice that this result was obtained without any additional smoothing!
Other examples are coming soon... Building of oil reservoir top surface from well picks, 2D and 3D seismic data.1. Building 2D seismic surface from scattered data points.In this example we have setof 1005 scattered data points with very noisy data. So, we going to approximate these points, instead of building interpolation surface 2. Building 3D seismic surface from scattered data points. 3D seismic data presented with 33673 data points, this data is more accuarate then 2D seismic and covers smaller area. Again we are going to approximate this data, but resulting surface should be not so smooth: 3. Building reservoir top surface from wellpicks, 3D and 2D seismic data. We have wellpicks data in points and we absolutely belive to this data. That's why our top surface should interpolate wellpicks. We will use 2D and 3D seismic surfaces as trends with 3D seismic higher priority Effective oil-saturated thickness estimation.
Please send any comments about this site to mdmitr at gmail dot com. |
|||