scattered data points
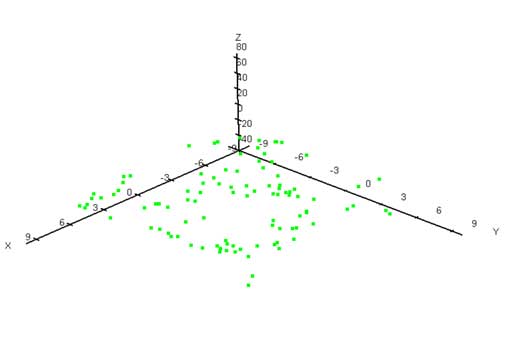
"Scattered data points" are used to represent irregularly spaced XYZ data. The term "irregularly spaced" implies that the points are randomly distributed over the extent of the map area meaning that the distance between data points is not consistent over the map. When the XYZ data is randomly spaced over the map area, there are many "holes" in the distribution of data points. Surfit fills in the holes by extrapolating or interpolating Z values in those locations where no data exists by applying rules defined by user.
|
| Scattered data points |
area
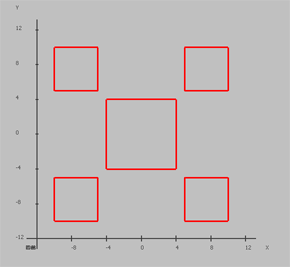
Areas are used to represent polygonal regions.
|
| Five areas |
curve
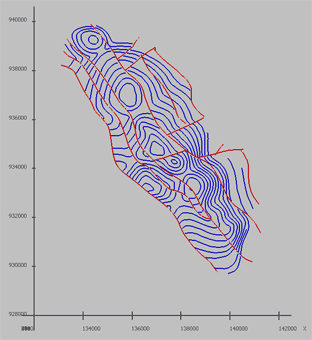
2D piecewise linear curve.
|
| Contours (blue) and curves, presenting fault lines (red) |
contour
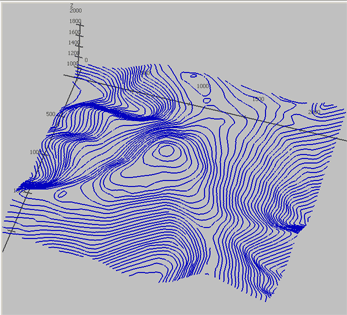
3D piecewise linear curve.
|
| Contours of Washington mountain |
surface
A digital representation of a continuous variable over a two-dimensional surface by a regular array of z values. Surfaces are typically used to represent terrain relief, soil maps, pressure fields and other.
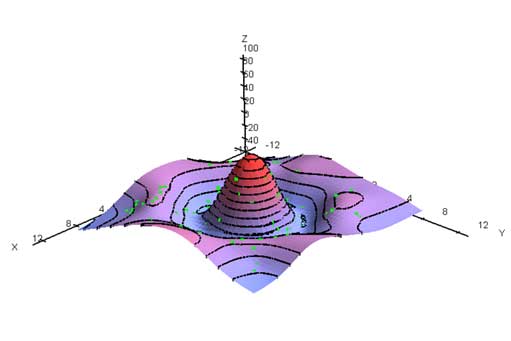
|
| Surface and scattered data points |
mask
This data is looks like surface, but cells values take only "true" or "false" values. Masks are used to filter out some parts of surface, i.e. to create the definition area for surface.
grid
grid is structure that determines places for the cells. surfit uses rectangular equidistant grid:

- See Also
-
histogram
http://en.wikipedia.org/wiki/Histogram