Functions | |
| boolvec * | contour (const char *cntr_name="*") |
| boolvec * | contour_add (REAL weight=50, const char *cntr_name="*") |
| boolvec * | smooth_contour (const char *cntr_name="*", REAL penalty_factor=0) |
| boolvec * | contour_leq (const char *cntr_name="*", REAL penalty_factor=0) |
| boolvec * | contour_geq (const char *cntr_name="*", REAL penalty_factor=0) |
Detailed Description
Function Documentation
| boolvec* surfit::contour | ( | const char * | cntr_name = "*" | ) |
- Tcl syntax:
- contour cntr_name
- Description:
- Using this rule the resulting surface approximates contour values.
- Math:
- This command adds the following functional to the functional sequence:
where (i,j) - indices of the cells cross with contour,![\[ \Phi(u_{1,1},\ldots,u_{N,M}) = \sum_i \sum_j \left( u_{i,j} - z_{i,j} \right)^2, \]](form_89.png)
 - contour mean value for the (i,j) cell.
| boolvec* surfit::contour_add | ( | REAL | weight = 50, |
| const char * | cntr_name = "*" |
||
| ) |
- Tcl syntax:
- contour_add weight cntr_name
- Description:
- This rule modifies a previous (modifiable) rule by adding the contour rule with some weight. Use this rule if you don't know contour values exactly. Using this rule the resulting surface approximates contour taking into account a previous (modifiable) rule.
- Math:
- This command modifies previous functional
 by adding
  :
:
where![\[ \Phi(u_{1,1},\ldots,u_{N,M}) = \Phi_0(u_{1,1},\ldots,u_{N,M}) + w\Phi_1(u_{1,1},\ldots,u_{N,M}), \]](form_65.png)
 - informational weight,
where (i,j) - indices of the cells cross with contour,![\[ \Phi_1(u_{1,1},\ldots,u_{N,M}) = \sum_i \sum_j \left( u_{i,j} - z_{i,j} \right)^2, \]](form_91.png)
 - contour mean value for the (i,j) cell.
| boolvec* surfit::contour_geq | ( | const char * | cntr_name = "*", |
| REAL | penalty_factor = 0 |
||
| ) |
- Tcl syntax:
- contour_geq cntr_name penalty_factor
- Description:
- This rule adds the surface condition - "the resulting surface at contour should be greater than or equal to contour values".
- Parameters
-
cntr_name contour name penalty_factor parameter for penalty algorithm
- Math:
- This command adds the condition:
where (i,j) - indices of the cells cross with contour,![\[ u_{i,j} \geq z_{i,j} \]](form_105.png)
 - contour mean value for the (i,j) cell
| boolvec* surfit::contour_leq | ( | const char * | cntr_name = "*", |
| REAL | penalty_factor = 0 |
||
| ) |
- Tcl syntax:
- contour_leq cntr_name penalty_factor
- Description:
- This rule adds the surface condition - "the resulting surface at contour should be lower than or equal to the contour values".
- Parameters
-
cntr_name contour name penalty_factor parameter for penalty algorithm
- Math:
- This command adds the condition:
where (i,j) - indices of the cells cross with contour,![\[ u_{i,j} \leq z_{i,j} \]](form_103.png)
 - contour mean value for the (i,j) cell
| boolvec* surfit::smooth_contour | ( | const char * | cntr_name = "*", |
| REAL | penalty_factor = 0 |
||
| ) |
\par Tcl syntax:
smooth_contour \ref str "cntr_name" penalty_factor

\par Description:
This rule tells surfit that resulting surface should approximate contour Z-values.
The result of approximation is that resulting surface should be very similar to given contours.
The main difference with \ref contour gridding rule is that resulting surface is
more smooth near contours.

\param cntr_name \ref d_cntr "contour" \ref str "name"
\param penalty_factor parameter for \ref penalty

\par Math:

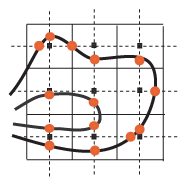
    Problem: we need to approximate contours (or isolines with different values) by adjusting
cell values. Let consider Figure 1: solid straight lines show cells borders, dot lines connect cells centers (black squares), thick black curves shows contours projection to the XoY plane. Red points on the figure are intersections of curves and dot lines.
\image html matr_sect.gif
Consider the case then the contours cross one of the dot lines, i.e. contours lay between two cells centers (see Figure 2). On the figure  and
and  are cells centers coordinates (X or Y),
  and
and  are adjustable values for those cells. Red circles are points where contours cross vertical plane (this plane comes through points
  and
and  ).
).  - are points coordinates (X or Y),
  - Z coordinates.

We are trying to approximate points  with straight line. To do this we are going to find a minimum of the following functional:
![\[ \Phi = \sum\limits_{i=1}^N \left( f(p_i) - z_i \right)^2 \rightarrow \min, \]](form_101.png)
where
![\[ f(p) = u_0 + (u_1-u_0) \frac{p-\overline{p}_0}{\overline{p}_1-\overline{p}_0}. \]](form_102.png)
To solve our problem we should write this functional for each pair of neighbour cells, if at least one of contours lays between them.
For more details see f_cntr_smooth.tex